III QUARTER OF 2020 REPORT NO. 1

Editorial team
Corporación 5. The opinions expressed in this document, as well as the data, information and forecasts are subscribed under the sole responsibility of the Corporación 5 company, editor of this document, and are not necessarily subscribed nor can any responsibility be attributed to FEDEPALMA.
This work is protected under the Creative Commons Attribution-Noncommercial-ShareAlike 3.0 Spain 3.0 Spain License.
You can get more information about it at:
http://creativecommons.org/licenses/by-nc-sa/3.0/en
A copy of this work can be found on the owner's site http://fedepalma.net/
This work has been prepared thanks to funding from FEDEPALMA.
Table of socioeconomic indicators of La Palma

Current situation
During the third quarter of 2020, the economic impact of the second wave of Covid-19 has been felt in a weaker recovery than predicted in previous quarters. Among its characteristics, it is distinguished by a high degree of uncertainty, which has not been observed in other crises that have occurred, in addition to registering a higher incidence of Covid-19 that has caused negative consequences in all sectors of the economy. The restrictions on mobility, the health effects, the declaration of national states of alarm, the complete paralysis of some economic activities and the closure of borders have generally caused negative effects both on the entire development of the economy and of society itself on a global scale. In an initial scenario, it was considered that the main harmful effects caused by the stoppage of activity, which have not been of equal importance in all sectors, would not extend over time. However, given the persistence of Covid-19 in society, determined by the existence of outbreaks and the establishment of partial restrictions on mobility, it has caused a greater impact on the economy in a generalized way, given the interrelationship between its different sectors. In this regard, the main negative results that Covid-19 has caused in the Canary archipelago have been recorded, fundamentally, in the tourism sector, hospitality and most of commerce. Although, given the knock-on effects of these sectors, the economy as a whole has seen the pace and volume of its activity slow down. Given this scenario, the negative impact observed on the economy in the Canary Islands has also been transferred to the rest of the islands. However, the negative effects are not of equal magnitude in each of them. In this sense, the island of La Palma is characterized by having a higher incidence of negative effects derived from the Covid19 health crisis than other islands (although the incidence of the virus among the population has been low), in addition to registering a generalized slow reactivation of its activity. The emergence of Covid-19 has modified the vision in any of the economic estimation models, as a result of its effects on the health of the population and the decline registered in the economy. In line with this, the depth and speed of its impact has led to revisions of the projections being carried out almost daily. Thus, it is essential to know what the particularities of what happened are, with the aim of having a reference or starting point that will make it easier for us to get out of this situation and begin a process of economic and social recovery. Given the above, the International Monetary Fund has revised its forecasts in accordance with the evolution of the pandemic situation on a global scale. According to the latest World Economic Outlook Projections report, published in October, Spain will be one of the most affected countries in terms of decline in GDP and employment compared to the rest of the world. For the 1 Last data available. For the euro zone as a whole, growth is estimated at -8.3% for the entire year 2020, which represents 0.8 p.p. more than the estimate made in the month of April (growth rate of -7.5%). Meanwhile, for Spain, this growth estimate is established at -12.8%, representing -4.8 p.p. compared to the forecast recorded in April of this year. Given the situation, according to IMF estimates, our country has the highest negative economic growth, not only with respect to the euro zone as a whole, but also among the so-called advanced economies. In the opposite case, China is located, since it is presented as the only country with a positive forecast for its economy, presenting an economic growth rate of 2% for 2020. According to the National Institute of Statistics of the Canary Islands (ISTAC), the estimate of the Gross Domestic Product (GDP) for the island of La Palma in 2018 amounted to 1,578.544 thousand euros, representing a meager, almost 3.50% of the regional GDP. Compared to 2017, the divergence of the palm economy with respect to the Canary Islands has increased, given that the growth of the island's GDP has been just over 2%, compared to that of the archipelago as a whole, which has been more than 3.3%. As a result of this scenario, and given the limited increase in the island population - growth rate of 0.63% for the period 2017-2018 -, which has been produced by an increase in the immigrant population, the GDP per capita for La Palma in 2018 has increased by 1.22%. Registering a figure of 18,785 euros, it is below the regional average, whose GDP per capita is approximately 20,900 euros. This behavior of lower growth of the island economy, together with the current situation, is a clear example that the economic situation already suffered from problems, which indicated to us that there would be no room to face said scenario. In this sense, the indicators of demand by the population and certain economic activities show a decrease in consumption, in addition to a reduction in business confidence, employment levels and activity associated with the tourism sector.
1. Demand indicators
Regarding the demand indicators on the island of La Palma, the consumption of available electrical energy in September 2020 amounts to 21,944 Mwh, representing 3.20% of the consumption made on a regional scale (685,992 Mwh). In terms of growth, it is notable that there has been a year-on-year increase in energy consumption at the island level of approximately 0.90%, while for the region as a whole the growth rate is almost 8.90%.
Graph 1. Available electrical energy (Mwh). The Palm. 2017-2020. ISTAC.

For its part, the automotive sector has suffered great negative consequences after Covid-19, although it has already been experiencing this behavior since the beginning of 2019. In relation to La Palma, the number of registrations has had a year-on-year variation in September 2020 of practically -2.40%, compared to the year-on-year growth rate on a regional scale of -40.5%.
Graph 2. Wholesale of cement (Tn). The Palm. 2017-2020. ISTAC.
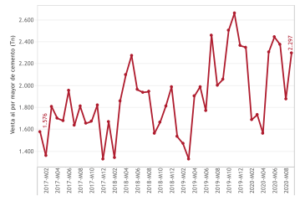
Finally, in relation to the construction sector, the wholesale sale of cement for September 2020 presents an increase compared to the previous month - monthly growth rate of more than 22.40% -. Furthermore, it has experienced a year-on-year increase of approximately 11.70%, which has been lower than that recorded for the Canary Islands as a whole -annual growth rate of 15.6%-.
2. Trust indicators
If this situation is transferred to the confidence indices in the business and consumer sectors2, the perception of each of them is, in general, negative. As far as the business confidence index is concerned, the opinion of establishment managers on La Palma for the third quarter of 2020 is positive, as it amounts to 121.5, although it has registered an interannual growth rate of -9.5%. This assessment is interpreted as a good forecast by the island's business community, compared to that made by the Canary Islands as a whole. In this sense, the business confidence index stands at 93.5 for the third quarter of 2020, also registering an interannual growth rate of approximately -22.9%.
Graph 3. Business Confidence Indicators (Base 2013). The Palm. 2017-2020. ISTAC.

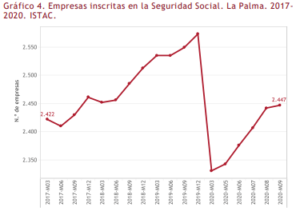
Given this context, on the island of La Palma, the figures for companies registered with Social Security in September 0 < i < 100 unfavorable perception i = 100 balance point 100 < i < 200 favorable perception 2020 present an interannual growth rate of -4%, lower than that registered in the Canary Islands, which is -5.3%. However, an opposite behavior is observed in relation to August, since there is an increase in companies registered with Social Security of 0.20%, at the island level, and of 0.40%, for the region as a whole.
Graph 4. Companies registered with Social Security. The Palm. 2017- 2020. ISTAC.
Graph 5. Consumer Confidence Indicators. The Palm. 2018- 2020. ISTAC.
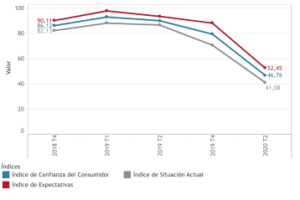
On the contrary, from the perspective of consumers, the confidence index for the second quarter of 20203 is quite unfavorable, given that it is estimated for the island of La Palma at 46.8, very similar to that registered for the autonomous community as a whole, of 46.6. Furthermore, a similar evolution is observed in year-on-year terms, registering a growth rate of -48.1% on an island scale, and -47.4% on a regional scale. Given this, there is a reduction in the degree of optimism of the 3 Latest data available. La Palma consumers, although not very far from that of the Canary Islands as a whole.
3. Labor market indicators
The negative consequences of Covid-19 on the economy are similarly transferred to the labor market. Given the general reduction in economic activity, job creation and the registration of labor demands have been reduced. In this regard, the activity rate for the third quarter of 2020 on an island scale is almost 57.4%, compared to that registered for the archipelago as a whole, 56.7%. However, in terms of evolution, the impact has been of lesser magnitude on the island of La Palma than for the autonomous community - year-on-year growth rate of -0.40% and -4.6%, respectively.
Graph 6. Evolution of the Activity Rate (%) (EPA). The Palm. 2017-2020. ISTAC.

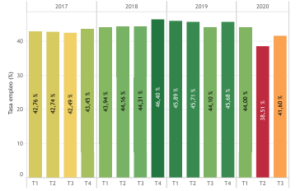
Given this, the employment rate for the island of La Palma in the third quarter of 2020 is estimated at 41.60%, registering an interannual growth rate of -5.67%, compared to that experienced by the region as a whole, of -9.21%. However, the employment rate has experienced an increase of more than 8% in relation to the second quarter of this year, while for the Canary Islands this growth rate has been -0.5%.
Graph 7. Evolution of the Employment Rate (%) (EPA). The Palm. 2017- 2020. ISTAC.
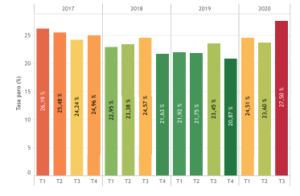
As a consequence of this scenario, the unemployment rate on the island of La Palma for the third quarter of 2020 has increased year-on-year by almost 17.30%, lower than that experienced on a regional scale, which has been almost 18.2%. However, in terms of figures, the opposite is true, since the island unemployment rate is more than 2% higher than the regional rate - unemployment rate of 27.5% and 25.04, respectively.
Graph 8. Evolution of the Unemployment Rate (%) (EPA). The Palm. 2017- 2020. ISTAC.
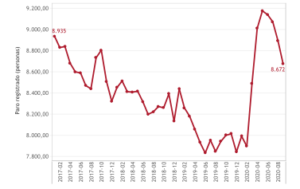
Thus, the registered unemployment in September 2020 for the island of La Palma is 8,672 people, representing 3.4% of regional registered unemployment. Regarding its evolution, unemployment on an island scale has experienced a monthly growth rate of around -2.5%, compared to that of the Canary Islands, of -1.21%. However, the interannual increase, in addition to being negative, is also of greater magnitude for the island of La Palma than for the Canary archipelago -9.2% and 24.3%, respectively.
Graph 9. Evolution of registered unemployment. The Palm. 2017-2020. ISTAC.
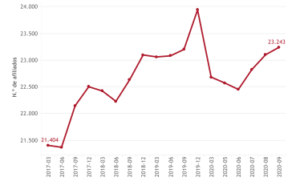
All in all, the number of Social Security affiliates in September 2020 for the island of La Palma presents an interannual increase of a scant 0.18%, compared to the growth rate of -4.4% registered by the Canary Islands.
Graph 10. Evolution of Social Security affiliates. The Palm. 2017-2020. ISTAC.
4. Indicators of the tourism sector
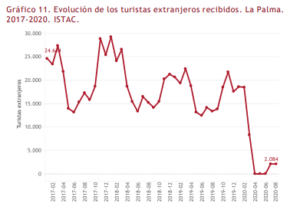
The reduction in activity in the regional economy as a whole is weighed down by the knock-on effects of the tourism sector. Mobility restrictions have negatively affected the entry of tourists, especially foreigners, who represented 8.7% of the total foreign tourists entering the archipelago in August 2020. In this regard, the interannual variation in the month of August for the island of La Palma has been almost -84.4%, much higher than that experienced for the Canary Islands as a whole, which amounts to -77%.
Graph 11. Evolution of foreign tourists received. The Palm. 2017-2020. ISTAC.
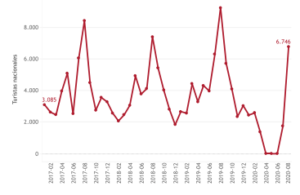
Meanwhile, national tourism for the island group, whose figures have been higher only in August 2020 compared to foreign tourism, has presented interannual growth rates of -26.9%, compared to -33.5% for the autonomous region as a whole.
Graph 12. Evolution of national tourists (excluding Canarian residents) received. The Palm. 2017-2020. ISTAC.
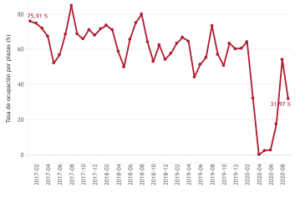
This decrease in the entry of tourists has been reflected in different indicators associated with the behavior of the sector. In relation to this, in September 2020, there is an interannual variation in the occupancy rate for the island group of more than -44%. For said month, an occupancy rate of approximately 32% has been recorded; one 10 percentage points above that quantified for the Canary Islands, which has had an interannual variability of more than -68.3%.
Graph 13. Evolution of occupancy rate by places (hotels and apartments). The Palm. 2017-2020. ISTAC.
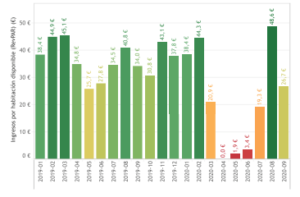
As a consequence of this decrease, revenue per available room (RevPAR), in correlation with the average stay, has been reduced. In this sense, the RevPAR of accommodation on the island of La Palma has registered an interannual growth rate of -21.62% in September 2020, lower than that observed for the region as a whole, whose value has been -67.3%. Furthermore, the island RevPAR in September 2020 exceeds that registered at the regional level, since it was 26.7 euros and 20.5 euros, respectively.
Graph 14. Evolution of revenue per available room (RevPAR) (euros). The Palm. 2017-2020. ISTAC.
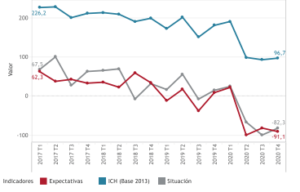
For its part, the average stay in accommodation on the island of La Palma has experienced an interannual reduction in September 2020 - a growth rate of approximately -29% -, registering an average stay of 4.6 days for said month. While the average stay in accommodation for the entire archipelago, which is 5.04 days in September 2020, has experienced a greater drop -growth rate of -32.5%-. As a consequence of this situation, expectations from the hotel sector are quite negative. In this sense, the Hotel Confidence Index in October 2020 is 96.7, so expectations for the sector are unfavorable, in addition to having experienced -46.5% below the same month of the previous year, a fall in line with that observed at the regional level (-44% in year-on-year terms).
Graph 15. Evolution of Hotel Confidence Indicators. The Palm. 2017-2020.
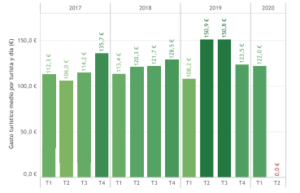
In parallel to this scenario, expenses per tourist per day have decreased considerably with zero tourism occurring in the second quarter of 20204, after the closure of borders and restrictions on mobility. However, it can be observed that the average tourist expenditure per tourist per day on an island scale ranges from 106-151 euros, for the quarters of the years 2017-2020. Meanwhile, for the same period and on a regional scale, the average expenditure is higher, with this range increasing to 120-151 euros. In accordance with this, the island of La Palma, like our Autonomous Community, has been significantly affected by the impact of Covid-19. Although, given the particularity of La Palma as a non-capital island, the consequences have generally been greater. Given this, the palm society has been greatly harmed in several aspects (social and economic), given the effects that the paralysis of economic activity has had. 4 Latest data available.
Graph 16. Average tourist spending per tourist per day (euros). The Palm. 2017-2020. ISTAC.